PLUS 1.5° ~ You are here. ~
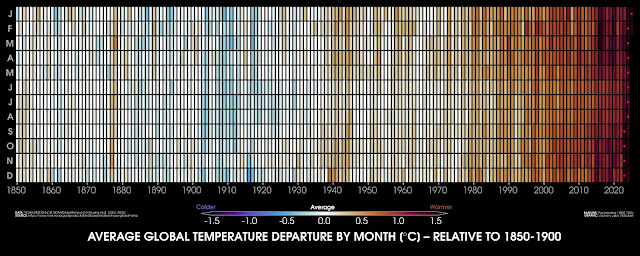
I'm presenting an UPDATED VERSION of a well-known chart today ...
Agriculture began around ten thousand years ago, in the early Holocene.
The Holocene marks the climatic framework that made agriculture possible in the first place (through a mild, stable climate; retreat of glaciers; formation of fertile soils).
How foolish of us to have left the blue safe zone?
--
Footnote: The ORIGINAL VERSION of this chart was created by Jane Morton ( @safeclimate ) years ago to convey rapid man-made global warming as a result of 'current policies'. Many experts still consider it a masterpiece of scientific communication.
See: https://bsky.app/profile/tieber.bsky.social/post/3lxp734g52c2h
( Thx , Jane! 🙇 )
My updated version is based, among other sources, on a dataset published this year by Leon Simons
('Global Warming has Accelerated Significantly').
( You may find it here: https://bsky.app/profile/leonsimons.bsky.social/post/3lphuutevs226 /
respective: https://bsky.app/profile/tieber.bsky.social/post/3lpxuejbrxs2l )
As you can see, current measurement data from NASA, NOAA, HadCRU, Berkeley and ERA5, as well as the significantly increased warming rate calculated from this data, were taken into account to extrapolate future intersections of devastating global heating on planet Earth.
--
The original source chart, as also shared by the *no longer active* NASA Climate accounts ...
( Twitter: @NASAClimate, Facebook: NASAClimateChange )


(🇬🇧) Just to be clear:
AntwortenLöschenWhen it says ‘very likely‘, that's what it means. It does not mean it won't happen. Nor does it mean it “might” happen. It means ‘very likely’.
When it says ‘before‘, that's what it means. It doesn't mean exactly in that year. Nor does it mean “later“. It means ‘before’ this year.
--
And just as a comparison: You know, the human body is a very resilient, complex organism. But even before your body temperature rises by +4°C, you will either be dead – or at least in absolute mortal danger.
So can you imagine how this will affect the much more complex ecosystem – all life on planet?
And one more thing:
The years mentioned are calculated on assumption that global warming will continue at same rate as it's happening right now. A simple calculation.
However, the rate of warming isn't constant. It has already accelerated. And it will probably continue to do so as we pass tipping points.
[ https://bsky.app/profile/tieber.bsky.social/post/3lylkdtkxbk22 ]
(🇩🇪): Und wenn da steht 'sehr wahrscheinlich' ("very likely"), dann meint es das auch. Es meint nicht, dass es nicht passieren wird. Es meint auch nicht, dass es "vielleicht" passieren wird. Es meint 'sehr wahrscheinlich'.
AntwortenLöschenUnd wenn da steht 'vor ...' ("before ..."), dann meint es das auch. Es meint nicht genau in jenem Jahr. Es meint auch nicht "später". Es meint 'davor'.
Und nur zum Vergleich: Wie du weisst, ist der menschliche Körper ein sehr widerstandsfähiger, komplexer Organismus. Aber noch bevor die Temperatur deines Körpers um +4°C ansteigt bist du entweder schon tot - oder du bist zumindest in absoluter Lebensgefahr.
Also kannst du dir vorstellen, wie sich Selbiges auf das viel komplexere Ökosystem auswirken wird - das gesamte Leben auf unserem Planeten?
Noch etwas:
Die genannten Jahreszahlen ergeben sich rechnerisch, unter der Annahme, dass sich die globale Erwärmung mit der selben Geschwindigkeit fortsetzt, mit der sie jetzt gerade passiert. Das ist eine einfache Rechnung.
Die Geschwindigkeit der Erwärmung bleibt aber nicht konstant. Sie hat sich bereits beschleunigt. Und sie wird dies wahrscheinlich weiter tun, da wir Kipppunkte überschreiten.
[ https://www.facebook.com/christian.tieber.7/posts/pfbid02iu1So3daNBX8wPTw7VLNeAKzXxBT64FyTL6YibQJ1jD52X9uWC8a2AgfyEG4UxPrl ]