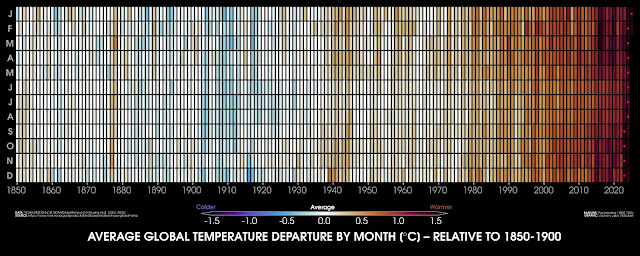
PLUS 1.5° ~ You are here. ~

I'm presenting an UPDATED VERSION of a well-known chart today ... Agriculture began around ten thousand years ago, in the early Holocene. The Holocene marks the climatic framework that made agriculture possible in the first place (through a mild, stable climate; retreat of glaciers; formation of fertile soils). How foolish of us to have left the blue safe zone? -- Footnote: The ORIGINAL VERSION of this chart was created by Jane Morton ( @safeclimate ) years ago to convey rapid man-made global warming as a result of 'current policies'. Many experts still consider it a masterpiece of scientific communication. See: https://bsky.app/profile/tieber.bsky.social/post/3lxp734g52c2h ( Thx , Jane! 🙇 ) My updated version is based, among other sources, on a dataset published this year by Leon Simons ('Global Warming has Accelerated Significantly'). ( You may find it here: https://bsky.app/profile/leonsimons.bsky.social/post/3lphuutevs226 / respective: https://bsky.app/pr...