Posts

Es werden Posts vom März, 2025 angezeigt.

Monatliche Anomalie der globalen Oberflächentemperatur von 1850 bis 2025

Bild
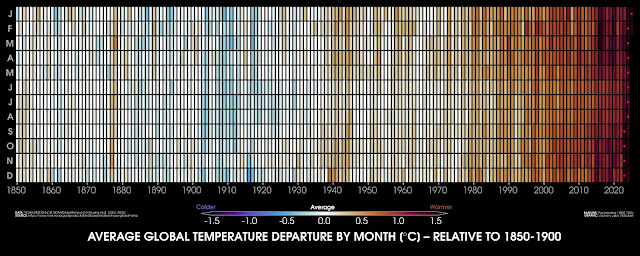
Grafik zeigt monatliche Anomalien der mittleren globalen Oberflächentemperatur von Januar 1850 bis Februar 2025. Kältere Monate sind blau, wärmere rot schattiert. Markierungen zeigen das Jahr des jeweils wärmsten Monats. All diese Rekorde sind im Zeitraum 2023 bis 2025 aufgetreten! (Basislinie: 1850-1900) via Zack Labe : "I've added a new visualization to my global climate change indicator page. I will update this graphic monthly at https://zacklabe.com/climate-change-indicators / It shows monthly mean temperature anomalies relative to pre-industrial levels. Red dots indicate the year of the warmest months."

"This is Collapse - What do we do now?"

Bild
University of Tasmania's Ao.Prof. Kate Booth as leader of Critical Collapse Studies hosted a critical collapse event with Australian collapsologist & co-founder of JustCollapse , Tristan Sykes and with German political scientist and climate justice advocate, Dr. Tadzio Müller ( friedlichesabotage.net ). Find the recording here: 👁️👂👇 This is Collapse - What do we do now? [ #TalkCollapse, (don't) #JustCollapse 🙃]

The trajectory of the Anthropocene: The Great Acceleration

Bild
Figure 1. Trends from 1750 to 2010 in globally aggregated indicators for socio-economic development. Figure 3. Trends from 1750 to 2010 in indicators for the structure and functioning of the Earth System.   Published in 2015 Will Steffen, Wendy Broadgate, L. Deutsch, O. Gaffney, C. Ludwig Source: https://www.semanticscholar.org/paper/The-trajectory-of-the-Anthropocene%3A-The-Great-Steffen-Broadgate/7d0b048c73a8e797fcb0a866701d6da8ab2c5aad